Article Text

Abstract
Background Although estimates of socioeconomic mortality disparities in Germany exist, the trends in these disparities since the 1990s are still unknown. This study examines mortality trends across socioeconomic groups since the late 1990s among retired German men aged 65 and above.
Methods Large administrative data sets were used to estimate mortality among retired German men, grouped according to their working-life biographies. The data covered the years 1997–2016 and included more than 84.1 million person-years and 4.3 million deaths. Individual pension entitlements served as a measure of lifetime income. Changes in total life expectancy at age 65 over time were decomposed into effects of group-specific mortality improvements and effects of compositional change.
Results Over the two decades studied, male mortality declined in all income groups in both German regions. As mortality improved more rapidly among higher status groups, the social gradient in mortality widened. Since 1997, the distribution of pension entitlements of retired East German men has shifted substantially downwards. As a result, the impact of the most disadvantaged group on total mortality has increased and has partly attenuated the overall improvement.
Conclusion Our results demonstrate that socioeconomic deprivation has substantial effects on levels of mortality in postreunification Germany. While East German retirees initially profited from the transition to the West German pension system, subsequent cohorts had to face challenges associated with the transition to the market economy. The results suggest that postreunification unemployment and status decline had delayed effects on old-age mortality in East Germany.
- social inequalities
- mortality
- elderly
- socio-economic
- unemployment
This is an open access article distributed in accordance with the Creative Commons Attribution Non Commercial (CC BY-NC 4.0) license, which permits others to distribute, remix, adapt, build upon this work non-commercially, and license their derivative works on different terms, provided the original work is properly cited, appropriate credit is given, any changes made indicated, and the use is non-commercial. See: http://creativecommons.org/licenses/by-nc/4.0/.
Statistics from Altmetric.com
Introduction
Socioeconomic differences in mortality among the elderly have been observed by a large number of studies and for nearly all Western societies.1–5 These studies found that members of lower educational, income and occupational groups experience substantial health disadvantages. Trend analyses have shown that from the 1970s until today, relative socioeconomic inequalities in health and mortality have been increasing in many European countries.6–9 The identification and alleviation of these disadvantages are a major public health challenge.
Mortality studies that rely on survey data often include a wide variety of health indicators and socioeconomic variables, but can be limited by problems related to representativeness and panel attrition. These problems can be overcome by conducting census-linked mortality studies. However, because German legal provisions do not allow for the linkage of mortality register and census data, Germany is not represented in many international comparisons of the social gradient in mortality. Recently, microdata from the German Pension Fund (Deutsche Rentenversicherung, hereafter DRV) became available. DRV data provide precise information on individual pension entitlements, which are based on individuals’ lifetime earnings subject to social insurance contributions, and cover over 90% of the population of German men aged 65 and older.
Studies that have made use of this data source have found social gradients in German old-age mortality by occupational group, pension benefit amount and type of health insurance.10–12 Previous findings have also suggested that mortality disparities by lifetime income in East and West Germany have widened over time.12 None of these studies investigated changes in the socioeconomic composition of the population and their impact on the life expectancy of the total population.
We draw on DRV data to investigate socioeconomic mortality disparities among retired German men aged 65 years and older over the longest possible period covered by this data source, 1997–2016. Following reunification, the East–West life expectancy gap that had been emerging began to shrink. However, the factors that contributed to this shift towards convergence are diverse and are not fully understood.13–18 Our study broadens the existing knowledge of mortality trends in eastern and western Germany after reunification. We analyse trends in the magnitude of mortality disparities by lifetime income among the elderly and examine the effects of group-specific mortality improvements and compositional changes on life expectancy at age 65.
Data and methods
We use cross-sectional data sets containing individual pension records (Rentenbestand, Rentenwegfall), and include information on all pensions paid by the DRV between 1997 and 2016.19 The data set used in the analysis consists of the annual information on death and person-years of exposure counts stratified by various sociodemographic characteristics. Because nearly all (about 98%) of the individuals in the cohorts under study had entered retirement by age 65,20 this age is used as the lower age limit of the study.
Our study improves on prior research based on DRV data10–12 in three important ways. First, we expand the period under study to 1997–2016 and include in the analysis all years within this range. Second, we use the entire set of DRV data, instead of subsamples of this data set. Third, we operationalise the regional and the socioeconomic variables differently to ensure the full consistency and comparability of the data across time. These features are explained in detail below.
Variables and population under study
The regional differentiation between East and West Germany is based on information about the location of a person’s place of work across his/her entire career. The person is classified as East (West) German if s/he spent more than 50% of his/her working life in East (West) Germany. The operationalisation of the regional indicator differs from that in earlier studies for two reasons. First, the individuals in the cohorts under study spent at least half of their working life in either the former German Democratic Republic (GDR) or the Federal Republic of Germany. This distinction is important because differences in people’s living conditions in early and mid-life could contribute to mortality differences at older ages. If the current place of residence was taken as the regional indicator, it would include no information about the length of time the person lived there and may not accurately reflect his/her earlier living conditions. Second, consistent pension regulations were applied across reunified Germany starting in 1992, and from this point onwards all German pensions have been calculated on the same legal basis. However, in recognition of the diverging political and economic conditions in the two countries, some special regulations are applied to periods of work in the former GDR only.
Under law, pension benefits continue to be calculated differently in the East than in the West. The most important East–West difference is in the value assigned to pension points (PPs), which are the basic measure of earned pension entitlements. If a person’s annual earnings are equal to the regional average income in a specific year, s/he will receive one PP for the respective period. Accordingly, if a person has received 0.7 PPs (1.3 PPs) in a specific year, this implies that the person’s income over this year was 30% below (above) the regional average. Thus, the number of individual PPs for calendar year t can be seen as a proxy for a person’s socioeconomic position relative to the whole working-age population in year t. How the individual’s periods of work are valued always depends on where s/he was working during those periods (East/West). When the person enters retirement, the sum of his/her PPs is multiplied by the current (at the moment of retirement) PP value, which still differs between the two regions. Therefore, the sum of PPs as an accumulated socioeconomic indicator is more connected to where people worked in the past than to where they are currently living. Moreover, because the interpretation of PPs is not time-dependent, PPs are particularly suitable for use in time trend analysis.
We divided the study populations in East and West Germany into fixed quintiles according to their numbers of accumulated PPs, taking the respective distribution of the year 2005 as the reference. PPs only refer to income subject to social insurance contributions up to a specified ceiling (Beitragsbemessungsgrenze). Earnings that exceed this limit do not result in the accrual of further pension entitlements. By law, civil servants and most self-employed individuals are not obliged to contribute to the public pension system.21 22 Thus, the sum of the PPs of these individuals does not reflect their ‘true’ working-life income. We identified members of those occupational groups by their type of health insurance (privately insured or voluntarily insured in the statutory health insurance system).
With the objective of obtaining a more comparable and reliable socioeconomic indicator, we excluded individuals not covered by compulsory health insurance from the analysis (table 1). For the same reason, we excluded former miners, individuals with foreign citizenship and ethnic German repatriates. Miners are subject to special pension regulations, which affects the comparability of this group with the total population (eg, lower legal retirement age, higher PP value). Foreigners and ethnic German repatriates were not included because most of these individuals spent only parts of their working life in Germany.
Shares of population groups excluded from the full DRV sample by German region
The final study population (restricted DRV sample) of East and West German men includes more than 84.1 million person-years (East: 19.8 million, West: 64.4 million) and about 4.3 million deaths (East: 0.9 million, West: 3.4 million). Detailed information on the annual distributions of the population at risk and the death counts for the full and the restricted DRV sample is available as online supplementary appendix (table A1, table A2).
Supplemental material
Because of the lower labour force participation rates among the female cohorts under study (especially among the West German women), PPs might not be a suitable indicator for a woman’s working-life income.11 12 Therefore, the analytical focus of this study is on socioeconomic disparities in male mortality.
Methods
We first calculated age-specific death rates on the basis of the midyear population and death counts by year, region and PP quintile. We then constructed complete period life tables (LT) from age 65 to age 90+ (open age interval), and calculated life expectancy at age 65, LE65. The empirical LE65 results were smoothed over age and year using the function Mort2Dsmooth from the R package MortalitySmooth.23
The social gradient in mortality was quantified by estimating the slope index of inequality (SII) and the relative index of inequality (RII). The SII and RII are regression-based measures that take the mortality level, the ranking and the population share of all socioeconomic groups into account.24 In our case, the indices can be interpreted as the expected (regression-based) difference in LE65 between the lowest and the highest status individuals. The SII displays the absolute difference in LE65 between the estimated bottom and the estimated top of the social hierarchy, while the RII displays the corresponding ratio.
We estimated group-specific population weights in the overall LT cohort. This allowed us to present total life expectancy as a weighted average of the life expectancies of the population subgroups.25 The socioeconomic groups considered in this study were constructed by splitting the population of pensioners into quintiles according to their pension entitlements. Thus, the weight of each group should be approximately 20% in the reference year (2005). As the group-specific quintile limits are held constant, the population distribution by socioeconomic group as well as the weights of these groups may change over time.
Finally, the life expectancy of the whole population can be seen as a function of group-specific mortality rates and compositional shares of population groups. A graphic image of how the life expectancy of the total population is shaped by population subgroups was proposed in our earlier study.25 Using the stepwise replacement algorithm,26–29 we decomposed increases in LE65 over time into components produced by group-specific mortality decreases and changes in the population composition.
Results
Trends in socioeconomic disparities in mortality
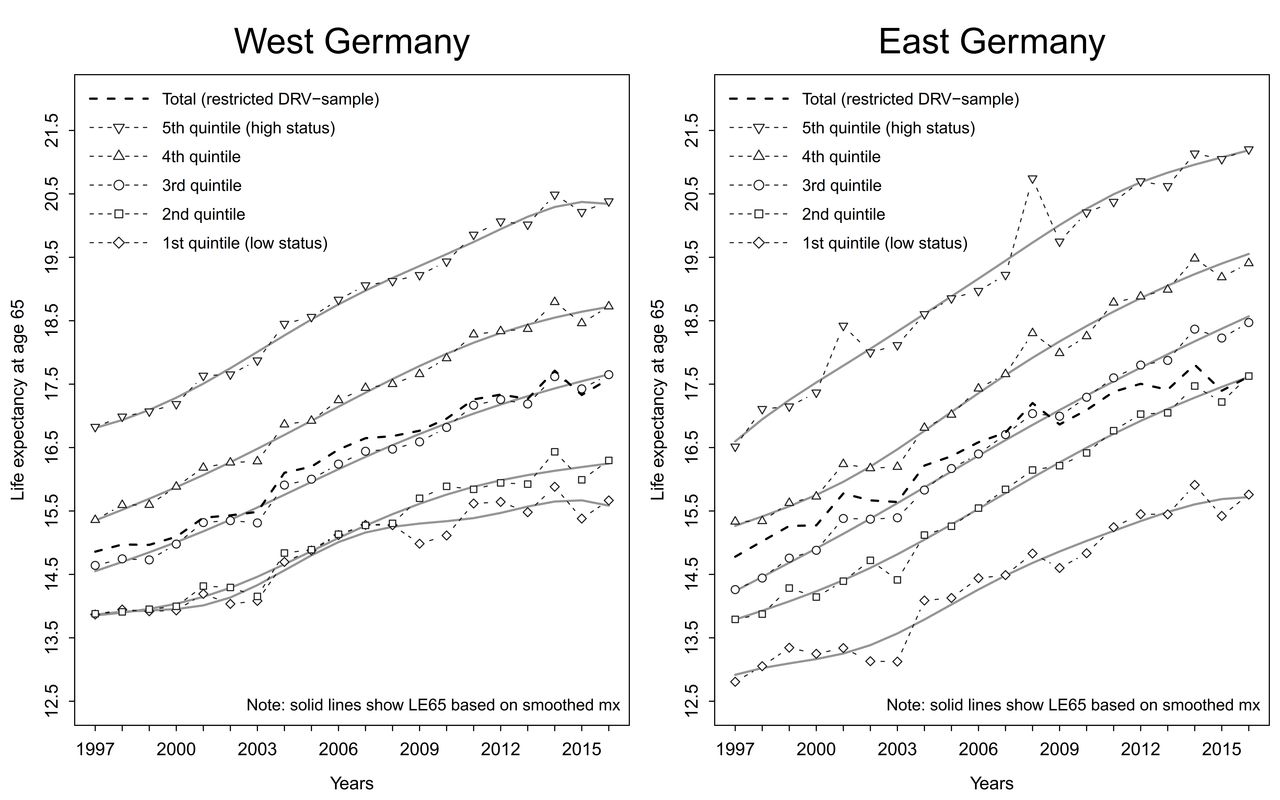
Mortality trends by income group for East and West German men are displayed in figure 1. Across all socioeconomic groups (restricted DRV sample), LE65 increased by 2.84 years in the East and by 2.72 years in the West between 1997 and 2016. In both regions, the absolute mortality improvements were largest in the most advantaged group (East: 4.68 years, West: 3.55 years) and smallest in the most disadvantaged group (East: 2.95 years, West: 1.80 years). Interestingly, the improvement in the total LE65 (all groups combined) in East Germany was much smaller than the group-specific lifetime gains.

Trends in total and group-specific life expectancy at age 65 among East and West German men, 1997–2016. DRV, Deutsche Rentenversicherung; LE65, life expectancy at age 65; mx, death rates.
The inequality measures (SII, RII) calculated from the group-specific empirical LE65 values and the group-specific population shares for East and West Germany are shown in figure 2. The linear trend lines point to a constant increase in socioeconomic mortality disparities for men in both German regions, but with a steeper social gradient in the East. The results also suggest that the inequality levels of both regions have been gradually converging over time.

Slope and relative index of inequality representing the extent of socioeconomic disparities in life expectancy at age 65 among East and West German men between 1997 and 2016. RII, relative index of inequality; SII, slope index of inequality.
Structure of the overall life expectancy by income group
The life expectancy of the total population can be expressed as the weighted average of the life expectancies of the population subgroups. The panels in figure 3 show LE65 by socioeconomic status (SES) groups and the corresponding population weights on total LE65 for 1997, 2005 and 2016. The width of each bar corresponds to the group-specific weight in the overall LT cohort, whereas the height of each bar corresponds to the group’s life expectancy. While the population composition by socioeconomic status remained nearly constant over time in the West, it changed enormously in the East. The lower three panels show that the distribution of pension entitlements among East German men shifted substantially downwards between 1997 and 2016. This compositional change resulted in an increased impact (weight) of the most disadvantaged group on the overall LE65, especially between 2005 and 2016. This explains why the improvement in the total life expectancy in East Germany was much smaller than the group-specific gains (see figure 1). Detailed information on the population shares of the SES groups and the group-specific weights is provided in online supplementary appendix table A3.
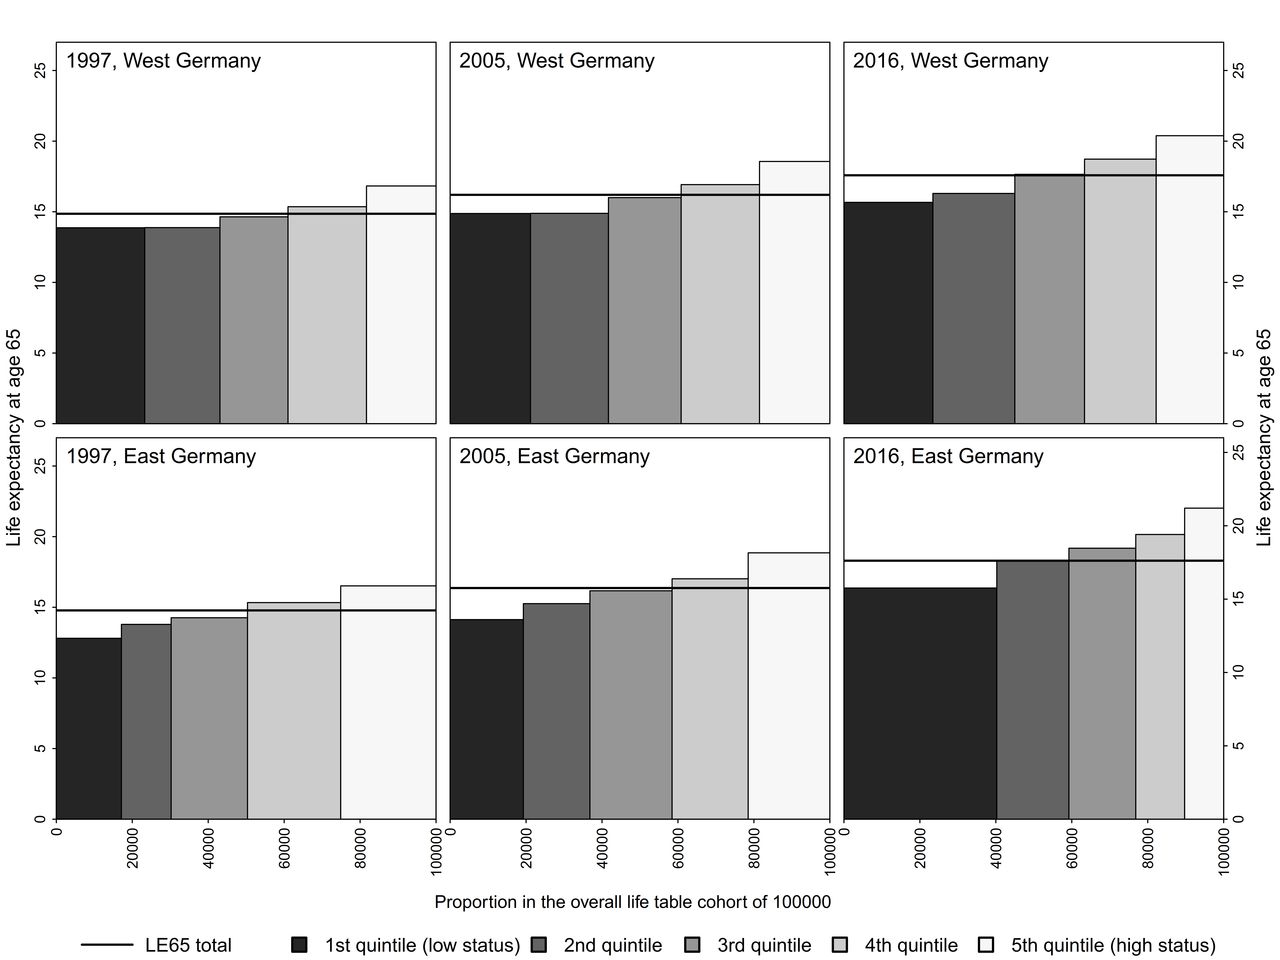
Distribution of overall life expectancy at age 65 by socioeconomic group for East and West German men in 1997, 2005 and 2016. LE65, life expectancy at age 65.
Decomposition of changes in life expectancy at age 65 between 2005 and 2016
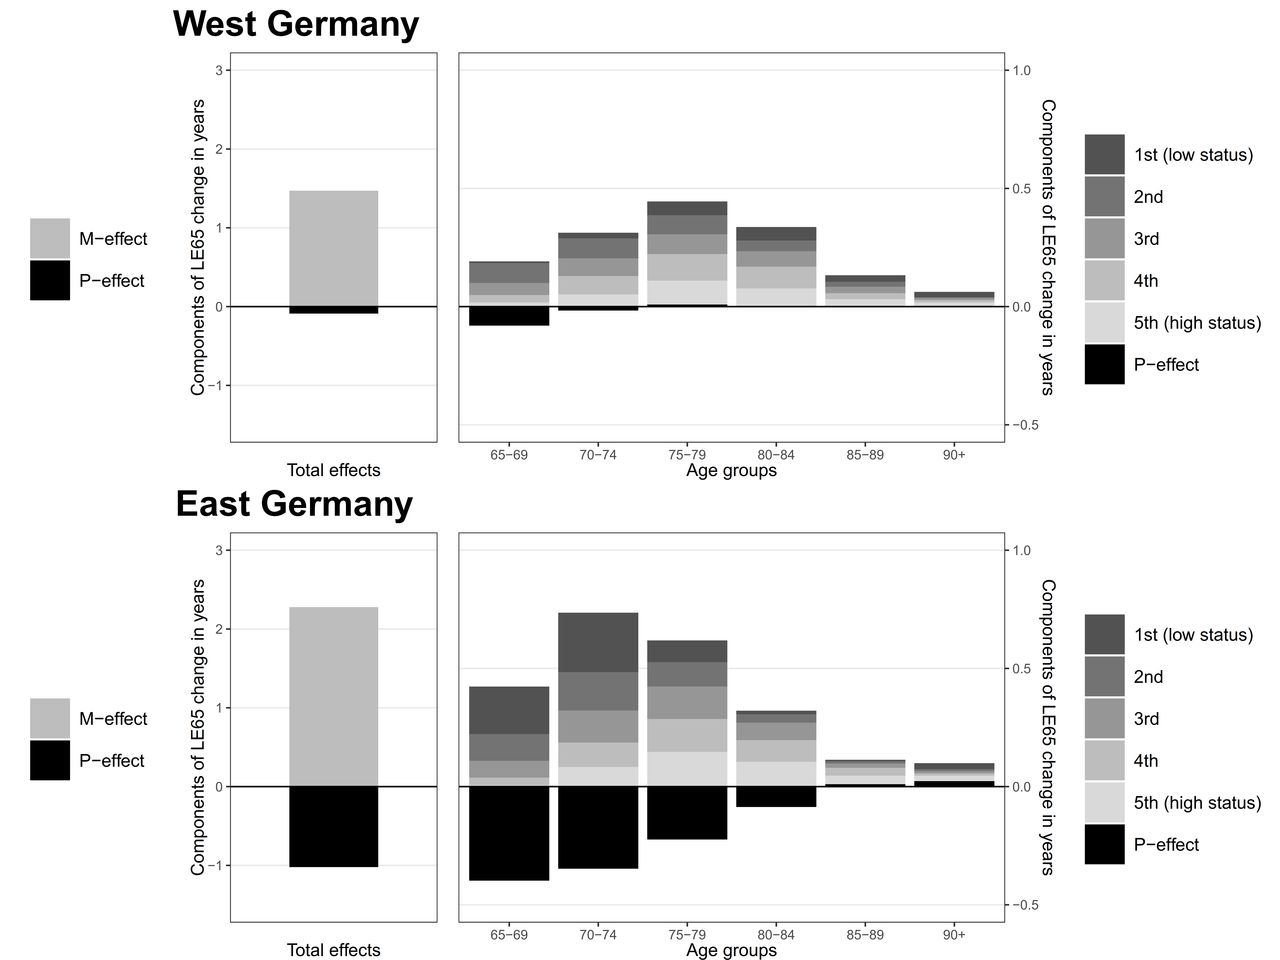
The results of decomposing the difference in LE65 over time by German regions are shown in figure 4. We chose 2005 as the starting year because the structural changes in East Germany mainly took place after this year (figure 3). We provide results for the decomposition of changes in LE65 for the whole observation period from 1997 to 2016 in online supplementary appendix figure A1. The left panels represent the total change in LE65 in each of the two regions between 2005 and 2016 as the sum of the mortality effect (M) and the compositional effect (P). The black bars indicate whether the compositional changes worked for or against the effect of mortality improvement. The P-effect is negative in both regions, but the magnitude of the effect is much larger in the East. These results should be interpreted as follows: if the socioeconomic composition of the East German population had been the same in 2016 as it was in 2005, the total LE65 in 2016 would have been about 1 year higher. The results for West German men indicate that the compositional effect on LE65 was only minor.
Decomposition of changes in life expectancy at age 65 of the total population between 2005 and 2016 for East and West German retirees by effects of mortality, population composition and age. LE65, life expectancy at age 65; P-effect, compositional effect; M-effect, mortality effect.
The figures in the right panel show a more detailed breakdown of the components by 5-year age groups and (within each age group) by group-specific M-effects and the compositional P-effect. They indicate how much each of the age-income groups contributed to the total change in LE65. We can see that in the East, the P-effect is a cohort effect. It might seem paradoxical that the lowest SES group in the East contributed the most to the overall change in LE65, but this development can be explained by the combination of two effects: (1) the growth in the size of the most disadvantaged group (in line with figure 3); and (2) the increase in the proportion of the disadvantaged group made up of younger ages.
Discussion
Summary of results
The results show that the trends in and the patterns of socioeconomic differences in mortality among retired men are quite similar in East and West Germany. Although the amount of mortality inequality (in both absolute and relative terms) is greater in the East, it has been increasing more quickly in the West, and levels of inequality in the two regions are gradually converging. In both regions, mortality improved faster in the wealthier groups, while those at the bottom of the socioeconomic hierarchy lagged behind. The most novel and striking finding concerns the downward shift in the socioeconomic composition of the population aged 65+ in the East that attenuates the overall LE65 increase in the region.
Interpretation
The reasons why this unfavourable change occurred are clear. The German pension system rewards workers for periods of continuous employment. Since there was almost no unemployment in the GDR, most East German retirees initially profited from the reunification process, and experienced improvements in both their living conditions and their health status.30 31 By contrast, younger East German cohorts had to deal with enormous socioeconomic upheavals. Approximately one-third of all jobs in the region disappeared in the 2 years following reunification.31 Because of this loss of employment, significant shares of these cohorts of East German retirees had disrupted working biographies and spent long periods of time unemployed. Moreover, legal changes implemented in the 2000s led to additional cuts in the pension entitlements of people who experienced periods of long-term unemployment.32 Consequently, the pension entitlements of East German retirees successively declined. These results suggest that in the East, this collective decline in socioeconomic status decelerated the trend towards gaining additional lifetime after age 65 by roughly 1 year.
However, the causal pathways behind this finding can be manifold and independent of the effect of current SES on mortality. First, the effect could be a direct consequence of the shock of (postreunification) unemployment at working ages.33 34 Second, the loss of income at working ages could have a long-term impact on health later in life.35 36 Finally, there might be a synergistic effect on mortality at pensionable ages that is produced by the combined action of past unemployment, past loss of income and current loss of pension income.
This study has important implications for the interpretation of recent unfavourable mortality trends in Western societies. Decelerating rates of mortality improvements as well as notable short-term declines in life expectancy due to severe influenza epidemics in winter 2014/2015 have been documented for many European countries.37–39 In the USA, declining life expectancy was reported between 2014 and 2016. The negative trend in the USA has mainly been attributed to increasing death rates from drug overdoses, suicides and alcohol-related conditions.40 Growing socioeconomic disparities are an important factor contributing to the unfavourable mortality trends in Europe and the USA.41 42 The case of Germany demonstrates that even at old ages growing social deprivation and income inequalities have clear potential to slow down improvements in mortality.
Our findings may be also linked to recent discussions in the UK about the disproportionate effects of austerity measures on vulnerable older adults. Some studies have linked the recent unfavourable mortality changes in the UK to cuts in expenditures on health and social care, as well as to reductions in spending on income support for poor pensioners.43–45 It is also possible that the above-mentioned changes in the German pension law are linked to the smaller mortality reductions observed in low status groups.
Strengths and limitations
So far, this is the most comprehensive study of trends in socioeconomic differences in East and West German old-age mortality. We used microdata from the German Pension Fund, which cover most of the German male population aged 65 and older. DRV data provide very precise information about population exposures and death counts.46 The population categories and the social status indicator were selected to ensure the consistency of estimates across time.
The pension data provide highly reliable information on accumulated income, a measure that reflects an individual’s whole working-life biography. This socioeconomic indicator has a double meaning: on the one hand, it reflects a person’s lifetime income, while on the other it is a measure of the pension payments the person is currently receiving. Both aspects may be important when estimating an individual pensioner’s risk of death.30 35
However, some limitations of our study have to be taken into account. First, we focused on male mortality only. Second, we excluded groups of pensioners for whom the application of our socioeconomic indicator might not have been suitable (eg, pensioners not covered by compulsory health insurance, former miners, foreigners and ethnic German repatriates).10–12 For these reasons, our mortality estimates do not line up precisely with the mortality estimates that cover the entire German population. Civil servants made up the largest share of the excluded subpopulations. The relationship between income, pension benefits and health within this group differs substantially from that in the total population. It is important to note that civil servants are a selective group because candidates for the civil service have to pass a health check. In the framework of our analytical method, civil servants would be artificially assigned to the lowest SES group because of their low PP levels, despite having low levels of mortality that are comparable with those of higher SES groups. Previous studies11 and our own additional analysis (not shown here) suggest that mortality is about 30%–40% lower among pensioners with private/voluntary health insurance than among pensioners with compulsory health insurance. Due to these discrepancies in the data, our West German study population had slightly higher mortality than the total population in the West. In the East, however, the mortality differences between these populations were negligible. The exclusion of the above-mentioned population groups improved the comparability and consistency of the trend analysis of socioeconomic mortality differences within and between the two regions. Moreover, our main findings regarding the impact of postreunification unemployment on mortality in the East are not affected by the exclusion of these small groups, who are in any case concentrated in the West German population.
Conclusion
Our results underline the importance of the effect of social status on longevity. The experiences of Germans before and after reunification demonstrate that improvements in people’s living conditions can lead to substantial lifetime gains, even when these improvements occur later rather than earlier in life.31 Our findings also indicate that the worsening of socioeconomic conditions at higher ages can have a substantial impact on life expectancy, attenuating the effects of potential improvements. While East German pensioners initially benefited from reunification, younger cohorts experienced a socioeconomic shock that hit the most vulnerable individuals especially hard. The smaller gains in LE65 observed among the low status groups in the East might be attributable to this shock. Additional cuts in the pension entitlements of the long-term unemployed that went into effect in the 2000s could further reinforce existing patterns of socioeconomic inequality in German old-age mortality.
What is already known on this subject
Earlier studies based on German pension data revealed mortality differentials across SES (socioeconomic status) groups and suggested that these disparities may be widening.
Rapid improvements in healthcare and living conditions in East Germany after reunification resulted in an immediate and substantial reduction in old-age mortality.
Whether more recent cohorts of East German retirees have similarly benefited from the West German system remains unknown.
What this study adds
This study assesses both temporal changes in old-age mortality by SES groups, as well as changes in the socioeconomic structure of the population.
The impact of these components on life expectancy in East and West Germany is quantified.
Our findings indicate that gains in life expectancy in Germany are not equally distributed over SES groups, as life expectancy among the groups at the bottom of the socioeconomic hierarchy in particular has gradually diverged from that of higher status groups since the early 2000s.
The decline in pension income among the more recent cohorts of retired East German men led to a deceleration in overall improvements in life expectancy at age 65 in East Germany of about 1 year, and this finding suggests that worsening socioeconomic status, even late in life, can lead to substantially reduced survival chances.
Pension regulations that disadvantage groups who are already deprived could further exacerbate the social disparities in old-age mortality in Germany.
Acknowledgments
The authors are grateful to Tatjana Mika and Dr Wolfgang Keck (Forschungsdatenzentrum der Rentenversicherung, FDZ-RV) for their valuable help with the data and their many important comments. We thank Rosie Seaman (MPIDR) for her constructive feedback and additional language editing.
References
Footnotes
Correction notice This article has been corrected since it first published. Reference 18 contained details from reference 19. These are now separate. In addition, affiliation 2 has been corrected.
Contributors GW conceived the research question and designed the study. GW and VS designed the methods for the decomposition of life expectancy by groups and the respective graphic images. GW conducted the statistical analysis, interpreted the results, and wrote the first and subsequent drafts of the manuscript. GW, PG and VS contributed to data interpretation and to revisions of the manuscript. All authors approved the final version of the submitted manuscript.
Funding The work by VS was partly supported by the Russian programme of state support for leading universities of the Russian Federation '5-100'.
Competing interests None declared.
Patient consent for publication Not required.
Provenance and peer review Not commissioned; externally peer reviewed.