Article Text

Abstract
Background As mortality is more and more concentrated at old age, it becomes critical to identify the determinants of old age mortality. It has counter-intuitively been found that mortality rates at all ages are higher during short-term increases in economic growth. Work-stress is found to be a contributing factor to this association, but cannot explain the association for the older, retired population.
Methods Historical figures of gross domestic product (Angus Maddison) were compared with mortality rates (Human Mortality Database) of middle aged (40–44 years) and older people (70–74 years) in 19 developed countries for the period 1950–2008. Regressions were performed on the de-trended data, accounting for autocorrelation and aggregated using random effects models.
Results Most countries show pro-cyclical associations between the economy and mortality, especially with regard to male mortality rates. On average, for every 1% increase in gross domestic product, mortality increases with 0.36% for 70-year-old to 74-year-old men (p<0.001) and 0.38% for 40-year-old to 44-year-old men (p<0.001). The effect for women is 0.18% for 70-year-olds to 74-year-olds (p=0.012) and 0.15% for 40-year-olds to 44-year-olds (p=0.118).
Conclusions In developed countries, mortality rates increase during upward cycles in the economy, and decrease during downward cycles. This effect is similar for the older and middle-aged population. Traditional explanations as work-stress and traffic accidents cannot explain our findings. Lower levels of social support and informal care by the working population during good economic times can play an important role, but this remains to be formally investigated.
- ECONOMICS
- MORTALITY
- ELDERLY
- PUBLIC HEALTH
Statistics from Altmetric.com
Introduction
Life expectancy in developed countries is continuously on the rise.1 A major part of the longevity increase was due to a mortality reduction at younger age, but in developed countries is now mainly attributable to a reduction of old age mortality.2 ,3 It is therefore important to investigate the determinants of old age mortality. Long-term economic growth is an important determinant of lower mortality rates of older people, as wealth creates health.4–6 Since many developed countries are currently in a recession, one could expect that this has a dampening effect on old age survival. However, it has been found that annual increases in unemployment, or decreases in gross domestic product (GDP), are associated with lower mortality rates at all ages. The association between macroeconomic cycles and mortality remains unknown. Since many developed countries are not only facing a recession but also growing shares of older people, there is a strong case to study the relation between macroeconomic cycles and old age mortality.
An association between mortality and short-term fluctuations in unemployment rates or GDP was found to exist in Germany,7 Japan,8 Mexico,9 Spain,10 Sweden11 ,12 and the USA.13–17 Two papers analysed the association in multiple countries, but only used age-standardised mortality rates.18 ,19 The counter-intuitive association between the economy and mortality has been explained by increased job-related stress, higher risk of traffic accidents and more unhealthy lifestyles during years of lower unemployment. Other explanations include lagged rather than concomitant effects (economic expansions diminish mortality rates, but with a delay)20 ,21 or spurious correlation due to methodological issues.22 ,23 Currently, the mechanisms underlying the association remain largely unknown. Of the aforementioned studies on mortality and short-term fluctuations in unemployment rates or GDP, a few considered old age mortality. Neumayer,7 Tapia-granados,10 Ruhm13 and Miller et al17 report that the association between short-term fluctuations in unemployment and mortality was also existent and relatively strong for older age categories, but further research is needed. Older, retired people will hardly be influenced by job-related stress, and they will not change their lifestyles as much as their younger working counterparts during different economic tides. All in all, older people are overlooked in many epidemiological studies on the association between the economic environment and mortality, and current explanations for the association do not suffice for older people. This is striking considering that many countries stand on the threshold of important demographic and financial changes.
The aim of the present study was to explore and analyse the association between macroeconomic cycles and cyclic variation in mortality rates of middle-aged and older people. There are two main differences between our study and the aforementioned studies. First, rather than comparing mortality rates with annual fluctuations in unemployment or GDP, we compare cycles lasting several years. Second, we focus on old age mortality and compare this with a middle-age working group. We also study this in a large group of countries, rather than in a single country. Other studies in multiple countries did not differentially study the older population.
Methods
Data collection
Data of GDP per capita and mortality of 19 developed countries between 1950 and 2008 were obtained from Angus Maddison's dataset and the Human Mortality Database, respectively.24 Maddison's dataset was used because it comprises data over a long period of time. To compare long cycles in the economy with changes in the trends of mortality, we considered that a dataset encompassing at least 50 years of data per country is required. The dataset offers estimated historical figures of GDP, defined as Geary-Khamis (G-K) dollars with purchasing power held constant with 1990 as the price level year. G-K offered a credited alternative to price power parity-adjusted figures of other economic institutes, such as the World Bank. Many studies on the association between the economy and mortality use unemployment as an indicator for a country's economic status, sometimes with income figures. We use GDP rather than unemployment for two reasons. First, only a few older people have jobs, so they are probably more directly influenced by changes in GDP rather than employment. Second, unemployment figures do not date back far enough to provide a long enough time frame.
Mortality rates were obtained from the Human Mortality Database for two age categories. The age group of 40–44 years old was chosen as the younger age group, because this group is chronologically in the middle of the working population of 20 to 60–65 years old. The older age group consists of people of 70–74 years old, who stand in the middle of the recently retired and the oldest old. The year 1950 is used as a starting point, because a dataset could then be collected that is up to date, large and does not suffer from the impact of two world wars and a recession in the interbellum. All 34 OECD countries were initially eligible for inclusion, but 14 countries were excluded because data concerning GDP or mortality were unavailable for the selected time period. In addition, Hungary was excluded because of methodological issues (see statistical analysis) and a turbulent historic background—including repression, revolution and the shift from a plan economy into a capitalist economy. Characteristics of the 19 included countries are shown in table 1.
Population size, real GDP per capita and mortality rates for both genders and two age groups for 19 OECD countries in 1950 and 2008
Statistical analysis
To capture cyclical variation in the economy and mortality, we transformed real figures of GDP and mortality rates into percentual deviations around the long-term trend. The long-term trend of GDP is expressed as the log-linear function
where α stands for the intercept, β the regression coefficient, Y for the year (1950–2008) and ɛ the error term. The log-linear function of mortality is calculated in a similar fashion. Using this method, the constant growth or decline rate is filtered out to retrieve the cyclic movements around its long-term trend and prevent interference from the trend itself. The average fit (R2) of all log-linear functions for GDP and mortality in the 19 included countries was 0.89. Hungary was excluded, in part because of the low fit of the long-term trends (R2=0.47). Figure 1 portrays figures of GDP (A) and mortality (B) as well as their long-term trends for the Netherlands from 1950 through 2008. In both panels, the arrow shows an example of a deviation. In previous literature, authors comparing GDP and mortality often use deviations from the Hodrick-Prescott trend.

Macroeconomic cycles and cylical variation in mortality, the Netherlands 1950–2008: example of the methods. Real figures and long-term trends (log-linear functions) of gross domestic product (A) and mortality rates (B) are shown. The arrow portrayed in both panels shows an example of a deviation from the long-term trend.
Separate analyses were performed for each country, gender and age group. Percentual deviations from the long-term trend are calculated by subtracting the log-linear function from the real figures, and expressing this value as a percentage of the log-linear function. In each separate analysis, deviations of mortality are regressed on deviations of GDP in a linear regression model. Owing to their cyclic nature, data in subsequent years are likely to be correlated and standard regression would underestimate uncertainty. Instead, we used Cochrane-Orcutt regression to account for autocorrelation and calculated Durbin-Watson test statistics.
The separate analyses were aggregated over all countries using a meta-analysis with a random effects model for continuous variables: the overall coefficients with CIs were estimated from the separate estimated coefficients and SEs for the 19 countries.25 Data transformations were performed in SPSS V.21.0. All statistical analyses were performed using Stata/IC V.9.2.
Results
Autocorrelation properties
According to the Durbin-Watson test statistic,26 70 of the 76 analyses (4 groups in 19 countries) show signs of autocorrelation. After applying the Cochrane-Orcutt method only seven associations still showed signs of autocorrelation. The following results are all adjusted for autocorrelation.
Macroeconomic cycles and mortality
In the long term, an increase in GDP is associated with a decrease in mortality in all countries. However, the cycles around the trends in GDP and mortality show a different association. An example of the association is given in figure 2. Here, percentual deviations from the trend for GDP and mortality in men aged 40–44 are shown for the Netherlands from 1950 through 2008. The deviations in GDP and mortality show a parallel, or pro-cyclical movement. This means that mortality rises in the Netherlands when its economy is in an upward cycle, or in other words, when the economy expands.
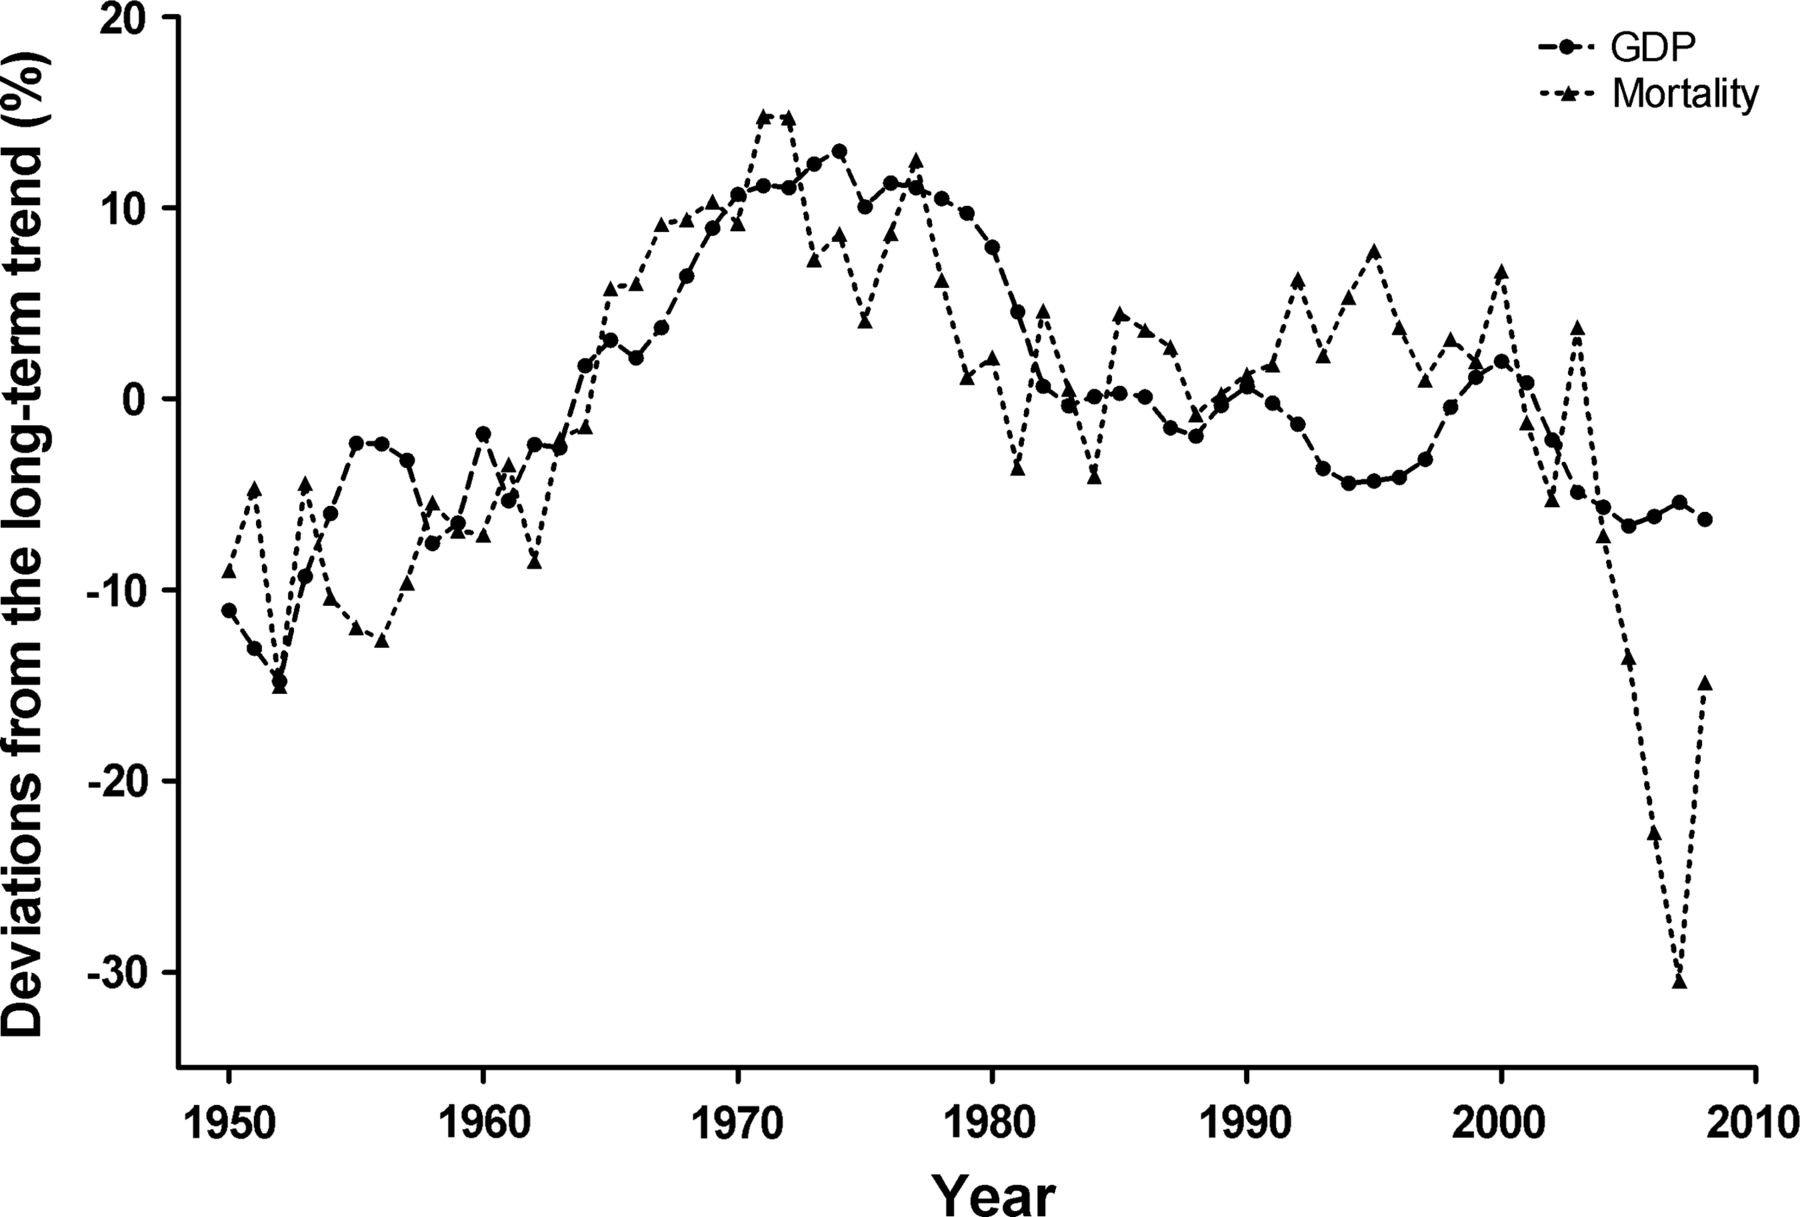
Parallel movement between macroeconomic cycles and cyclical variation in mortality in the Netherlands from 1950 through 2008. Cyclical variation in gross domestic product and mortality are defined as percentual deviations from the long-term trend.
The forest plots in figure 3 summarise the associations between macroeconomic cycles and cyclical variation in mortality for all the analysed countries. The means, CIs and significance levels of the associations are presented in online supplementary appendix table 1 (only in the online version of the article). The coefficients in the forest plots reflect the change in percentual deviations from the long-term trend for mortality with every 1% change in deviations of the country's GDP. A positive coefficient thus stands for a pro-cyclical association, whereby mortality increases during economic expansion.

Associations between macroeconomic cycles and cyclical variation in mortality. Associations of a 1% rise in the macroeconomic cycle with a change in the cyclical variation of mortality are shown. A positive coefficient shows that mortality rises during economic expansion, and lowers during economic downturns. Estimates are coefficients from a linear regression model with corresponding 95% CIs. Open symbols represent the weighted average and 95% CI as derived from a random effects model. Association for men 40–44 in Norway missing, because transformation of autocorrelation properties not possible.
For men aged 70–74, mortality rates increase in 17 of the 18 countries when the economy expands (analysis for men aged 40–44 in Norway could not be performed, since transformation of autocorrelation properties was not possible). Of these pro-cyclical associations seven are significant. On average, mortality in older men show an increase of 0.36% (95 CI 0.22 to 0.50; p<0.001) for every 1% the macroeconomic cycle moves upward. For the middle-age male group, mortality rates in 16 countries also show a pro-cyclical movement, of which seven are significant. On average, mortality trends of men age 40–44 increase with 0.38% (95% CI 0.19 to 0.56; p<0.001) for every per cent the economy expands.
For women aged 70–74 (figure 3), mortality rates increase in 16 countries when the economy expands. Seven of these pro-cyclical associations are significant. The remaining three anticyclical associations are all significant (Canada, Ireland and Sweden). On average, mortality for this age group increases with 0.18% (95 CI 0.04 to 0.32; p=0.012) when the macroeconomic cycle moves upward with 1%. Mortality rates of women age 40–44 show a pro-cyclical association in 12 countries, of which 6 are significant. Of the seven anticyclical associations, two are significant (Finland and Japan). On average, mortality trends of women age 40–44 increase with 0.15% (CI 95% −0.04 to 0.34; p=0.118) for every per cent the macroeconomic cycle goes upwards.
Discussion
In many developed countries de-trended mortality rises during upward macroeconomic cycles, and lowers in downward cycles. In the 19 countries we investigated, this pro-cyclical movement of mortality was similar for men of middle and old age (40–44 and 70–74 years). These findings can be explained in four different ways: (1) the economy affects mortality pro-cyclically, (2) mortality rates in a country affect economic figures, (3) mortality lowers due to better economic times, but with a lagged effect and (4) there is a spurious correlation between GDP and mortality rates.
It is plausible that a pro-cyclical movement between the economy and mortality exists. Gerdtham and Ruhm18 have found that a 1% decrease in unemployment is associated with a 0.4% increase in cardiovascular disease, 1.1% in influenza/pneumonia, 1.8% in liver disease, 2.1% in motor vehicle deaths and 0.8% in other accidents. Lower unemployment rates during downward cycles in GDP can induce these job-related stress factors. However, direct job-related factors do not explain our finding that older people react at least similarly to changes in the economy as middle-age people. It is known that air pollution increases during economic expansions,27 but evidence for a relation with mortality in older people is lacking. Furthermore, air pollution does not explain why men suffer more during good economic times than women. It could be that other factors are at play at higher ages. For example, changes in social support can have a considerable impact on old age mortality.28–31 When employment rates and the amounts of workload increase for the working population, it is plausible that there is less time for informal care-giving by younger relatives and friends for the chronically ill or oldest old. Also, the non-working older partner can be overburdened with informal care when the working children have less spare time, leading to higher mortality in the older care-giver group.32
Another possible explanation of the first kind is of a psychosocial nature, known as the inhibition effect.22 Studies show that persons who remain employed during times of higher unemployment reduce their alcohol consumption, and exhibit less antisocial behaviour.33 ,34 Also, the number of road accidents and other traumas decreases with higher unemployment, although suicide and homicide rates increase.35 ,36 Ruhm14 found that during times of lower unemployment smoking and obesity figures increase, diets become more unhealthy and physical exercise decreases. It could be that older people show the same kind of inhibition effect during downward cycles in the economy. The effect might even be stronger for pensioners, because they do not have the effect of increased risk of mortality by unemployment to counterbalance the inhibition effect. On the contrary, older people are less inclined to show this kind of behaviour on the basis of changes in GDP, since they are less dependent on the economy than employed or job-seeking individuals. Also, unhealthy lifestyles usually do not result in increased mortality risk immediately, but some years later.
Second, one could also argue for reversed causality that changes in mortality rates influence economic variables. Macroeconomic cycles are partly dependent on shifts in the demographic composition of a country, such as immigration and labour force supply. Taking this point of view, one could argue that old age mortality influences the economy. If mortality rates of the non-working population increase relative to those of the working population, average figures of labour productivity per capita will increase, raising per capita figures of GDP.
Third, economic expansions may decrease mortality with a delay. What seems as concomitant variation on first sight, could be a lagged reversed causal relation in reality. Some authors propose this delayed effect is the true dynamic behind the found effect of short-term fluctuations in the economy and mortality.20 ,21 However, graphs comparing deviations in GDP and mortality for the 19 investigated countries show that cycles move in a concomitant fashion, and no lag effects can be detected.
Finally, there could be a spurious association between economic and mortality figures.22 23 In this case, methodological issues in time-series analyses, or the existence of a third variable, are at play. Concerning methodological issues, we tried to avoid an important caveat by adjusting for autocorrelation. Concerning a third variable, many determinants or even confounders could cause changes in economic and mortality figures, such as health policies, air pollution or informal care. To acquire enough data to analyse macroeconomic cycles, a dataset comprising many years was needed. More specific data on potential explanatory variables were not available for the selected time period. Furthermore, data about underlying causes of mortality rates are available through the OECD, but these data are only available for age-standardised mortality rates, and not age-specific mortality rates.
This implies that further research with the inclusions of such omitted variables is needed to unravel the seemingly pro-cyclical association between the economy and mortality in developed countries. Especially panel studies could greatly contribute to our understanding of the dynamics behind the association. This applies especially for explaining changes in mortality trends of older people, where current explanations do not suffice. Another limitation of our broad dataset is that many differences between the here included countries could not be analysed. We included all countries for which figures of GDP and mortality were known from 1950 onwards, without paying attention to, for example, the differences in demographic composition or culture. The statistically significant reversed relationship we found for women in some countries suggest that there is heterogeneity among the countries.
A strong aspect of this study is that we are the first to compare long cycles in GDP and cyclical variation in mortality. Earlier studies on the association between the economic environment and mortality have focused on short-term fluctuations in unemployment or GDP. Furthermore, our analysis includes a very comprehensive dataset with economic and mortality figures in over 50 years for 19 developed countries. Earlier studies analysing multiple countries use age-standardised mortality rates only.
The counter-intuitive association between macroeconomic cycles and cyclical variation in mortality needs further explanation. So far, the most plausible explanations have been labour-related, but these cannot explain the similar associations we found among older people. Higher levels of air pollution and lower levels of informal care and social support during good economic times could be major contributors to the association, but the evidence on the existence of such dynamics is scant. In times of economic turmoil and population ageing, further exploration of the effects the economic environment can have on the well-being of older people is of great importance.
What is already known on this subject
-
Mortality rates of people in many age categories are higher when unemployment rates are low, or gross domestic product (GDP) has increased.
-
During years of lower unemployment, the frequency of traffic and work-related accidents, as well as unhealthy lifestyles is higher.
What this study adds
-
A high coverage: two different age categories in 19 OECD countries over a wide timespan (1950–2008).
-
We compare cyclical variation in the economy and in mortality, rather than annual fluctuations around the cycles.
-
Mortality of older people and middle-aged people is higher during upward cycles in GDP and lower during downward cycles.
-
This effect is similar for men of older age and middle age. The effect is smaller for women, especially for women of middle age.
-
Therefore, other determinants than work-stress and employment should be considered for this association.
Acknowledgments
The authors would like to thank Kurt Annen for offering a free add-in for Excel, and Maarten Lindeboom and Jeanine Houwing for offering theoretical and statistical advice.
References
Supplementary materials
Press release notice
Files in this Data Supplement:
Supplementary Data
This web only file has been produced by the BMJ Publishing Group from an electronic file supplied by the author(s) and has not been edited for content.
Files in this Data Supplement:
- Data supplement 1 - Online appendix
Footnotes
-
Contributors HJAR, DvB and RGJW contributed to the conception and design of the study; and retrieval of data. HJAR, DvB, WBvdH and RGJW contributed to analysis of the data; interpretation of the data; drafting the article or revising it and final approval of the version published.
-
Competing interests None.
-
Provenance and peer review Not commissioned; externally peer reviewed.