Article Text

Abstract
Objective To investigate and compare the main determinants of overall inequality and wealth-related inequality in under-5 mortality in 13 African countries.
Methods Data from Demographic and Health Surveys conducted in 2007–2010 in African countries were used. The study assessed the contribution of determinants to (1) overall inequality in under-5 mortality measured by the Gini index and (2) wealth-related inequality in under-5 mortality measured by the concentration index. Techniques used were multivariate logistic regression and decomposition of Gini and concentration indexes.
Results Birth order and interval and region contributed the most to overall inequality in under-5 mortality in a majority of countries. A significant wealth-related inequality was observed in five countries: DRCongo, Egypt, Madagascar, Nigeria and Sao Tome & Principe. Overall, household wealth, father's occupation and mother's education contributed the most to this inequality, though the ranking of the most important determinants differed across countries.
Conclusions Assessing the contribution of determinants to overall inequality and to wealth-related inequality in under-5 mortality help in prioritising interventions aiming at improving child survival and equity.
- CHILD HEALTH
- INEQUALITIES
- SOCIO-ECONOMIC
- INTERNATIONAL HLTH
- PUBLIC HEALTH
Statistics from Altmetric.com
Introduction
The global under-5 death rate has dropped from 88 deaths/1000 live-births in 1990 to 57 in 2010.1 However, despite substantial progress in reducing average under-5 mortality, disparity in under-5 mortality remains high: children from rural, poorer households and children of less-educated mothers are more likely to die before their fifth birthday. Tackling inequalities in health has become the new challenge. The Commission on Social Determinants of Health (CSDH) was initiated by WHO in 2005 to understand the social determinants of health, how they operate and how they can be changed to improve health and reduce health inequalities. One of the overarching recommendations of CSDH was to better measure and understand health inequality problems—within countries and globally—as a vital platform for action.2
The highest rates of under-5 mortality are observed in sub-Saharan Africa, where 1 in 8 children dies before age 5.1 Accelerating the decline in under-5 mortality is possible by expanding interventions that target the most vulnerable children (eg, removing financial and social barriers to accessing basic services). Reaching the marginalised subpopulations is therefore important not only from the point of view of social justice but also from a general public health perspective. For this purpose, information on the several dimensions of social and geographic stratification is needed.3
Once health inequalities have been observed in a population, a logical step towards guiding interventions aimed at reducing health inequalities is to understand the observed differences, for example, why do children from poor households have higher mortality? Specific analytical tools, such as a decomposition analysis,4 are then needed in order to analyse the determinants of these health inequalities. Such tools allow an understanding of how a determinant affects inequality: through its more unequal distribution across the population (eg, illiteracy is more prevalent among poor mothers) or through its greater association with the health outcome (eg, mother's illiteracy is associated with infant mortality).4 ,5
Policy actions can be defined differently depending on whether the aim is to address the improvement of average health levels or whether it is to reduce health inequalities.6 The aim of the study was to investigate the main determinants of overall inequality in under-5 mortality and of wealth-related inequality in under-5 mortality in 13 African countries.
methods
Study site and population
Data from the Demographic and Health Surveys (DHS) were used. All African countries with a standard DHS completed between 2007 and 2010 were included: DRCongo, Egypt, Ghana, Kenya, Lesotho, Liberia, Madagascar, Malawi, Nigeria, Sao Tome & Principe, Sierra Leone, Tanzania and Zambia. Egypt was the only non-sub-Saharan country selected, but was still included to allow a study of inequalities in a low under-5 mortality country. The analysis was restricted to children born alive within 5 years before the interview. Details on survey sampling, data collection and data processing can be found on the countries’ final reports, available from the Measure DHS website.7
Data and measures
The outcome variable was under-5 (0–59 months) death. This information was obtained from the birth history of interviewed women aged 15–49.7 The determinants investigated were: skilled birth attendance (whether or not birth was attended by a doctor, a nurse or a midwife), sex of the child, birth order and interval between births (categorised as: first birth; birth order 2–4 after a short (<24 months) birth interval; birth order 2–4 after a long (≥24 months) birth interval; birth order ≥5 after a short-birth interval; birth order ≥5 after a long-birth interval), mother's age at birth (<20 years old or not), type of residence (urban or rural), region, parents’ education level (none or primary and above), parents’ occupation (categorised as: household/domestic, not working, unskilled manual; agriculture; other) and household wealth index (low: quintiles 1–2 or high: quintiles 3–5). The wealth index, computed by DHS, comprises household assets (type of flooring, water supply, sanitation facilities, electricity, persons per sleeping room, ownership of agricultural land, domestic servant and other assets). The choice of determinants and categories was based on results from previous studies assessing the determinants of under-5 mortality.8–16 The categories of variables were willingly large to avoid analytical problems (multicollinearity resulting from the very small number of cases in several categories) that occurred in some countries.
Ethical consideration
The study was based on data from the DHS programme. What is done to maintain high ethical standards is described in ref. 17
Data analysis
Datasets were transferred to RGui (R V.2.14.2., The R foundation for Statistical Computing) for analysis.
The concentration index (C)18 was used as a measure of socioeconomic inequality: briefly, a relative concentration curve plot on the x-axis, the cumulative proportion of children ranked by household wealth, and on the y-axis the cumulative proportion of the variable of interest (under-5 mortality or a determinant). C is defined as twice the area between the concentration curve and the diagonal (line of equality). In case of maximal equality, the concentration curve lies on the diagonal and C equals 0. If the curve is above the diagonal, C is negative and the variable of interest is more prevalent among the poorer households. The value of C ranges between –1 and 1. However, the bounds of C for a dichotomous variable depend on the mean of the variable.19 Given that, a normalised C (C*) proposed by Erreygers was computed when comparing countries.
Univariate and multivariate analyses were performed by country. Under-5 mortality was first computed across categories of determinants, and proportions were compared using χ2 test. Then, a multivariate logistic regression model was used. Explanatory variables were: low household wealth, absence of skilled birth attendance, male sex, birth order and interval categories, mother's age at birth <20 years, rural residence, low parents’ education and parents’ occupational categories. Dummies were created for the categories of each variable and the analysis was performed on dummies. As father characteristics were included, analyses were restricted to children from mothers who ever married/lived with a man (above 93% of children in all other countries except in Liberia: 87% and Lesotho: 88%). Multicollinearity was checked and no variance inflation factor was greater than 10. The criterion used for statistical significance was α=0.01. No selection of models was carried out as the objective was to study the contribution of all the determinants included. Analyses were weighted (weights provided with the DHS data) and adjusted for the cluster randomised sampling frame (with cluster as the primary sampling unit and household as the secondary sampling unit).
The decomposition analysis was performed on predicted (ln odds) under-5 mortality given the observed values of the determinants to satisfy the linearity assumption of the decomposition method.20 The overall inequality in predicted under-5 mortality measured by the Gini index (G)21 and the wealth-related inequality in predicted under-5 mortality measured by C18 were decomposed using Wagstaff's method.20 The method is described elsewhere in detail.4 ,5 ,20 ,22 G is similar to C with the socioeconomic variable being replaced by the health variable itself. In other words, the cumulative proportion of predicted under-5 mortality is used on the y-axis and the cumulative proportion of children ranked by predicted under-5 mortality is used on the x-axis. As the analysis is performed on predicted under-5 mortality values having a negative mean, the value of G ranges between 0 and −1. In addition, as an alternative method for assessing the contributions of determinants to the overall variability in under-5 mortality, the variance of predicted under-5 mortality was decomposed using Shorrock's method.23 Finally, contributions of determinants were ranked by importance and median ranks across countries were calculated.
Results
Countries’ profile: geographical inequalities in average under-5 mortality
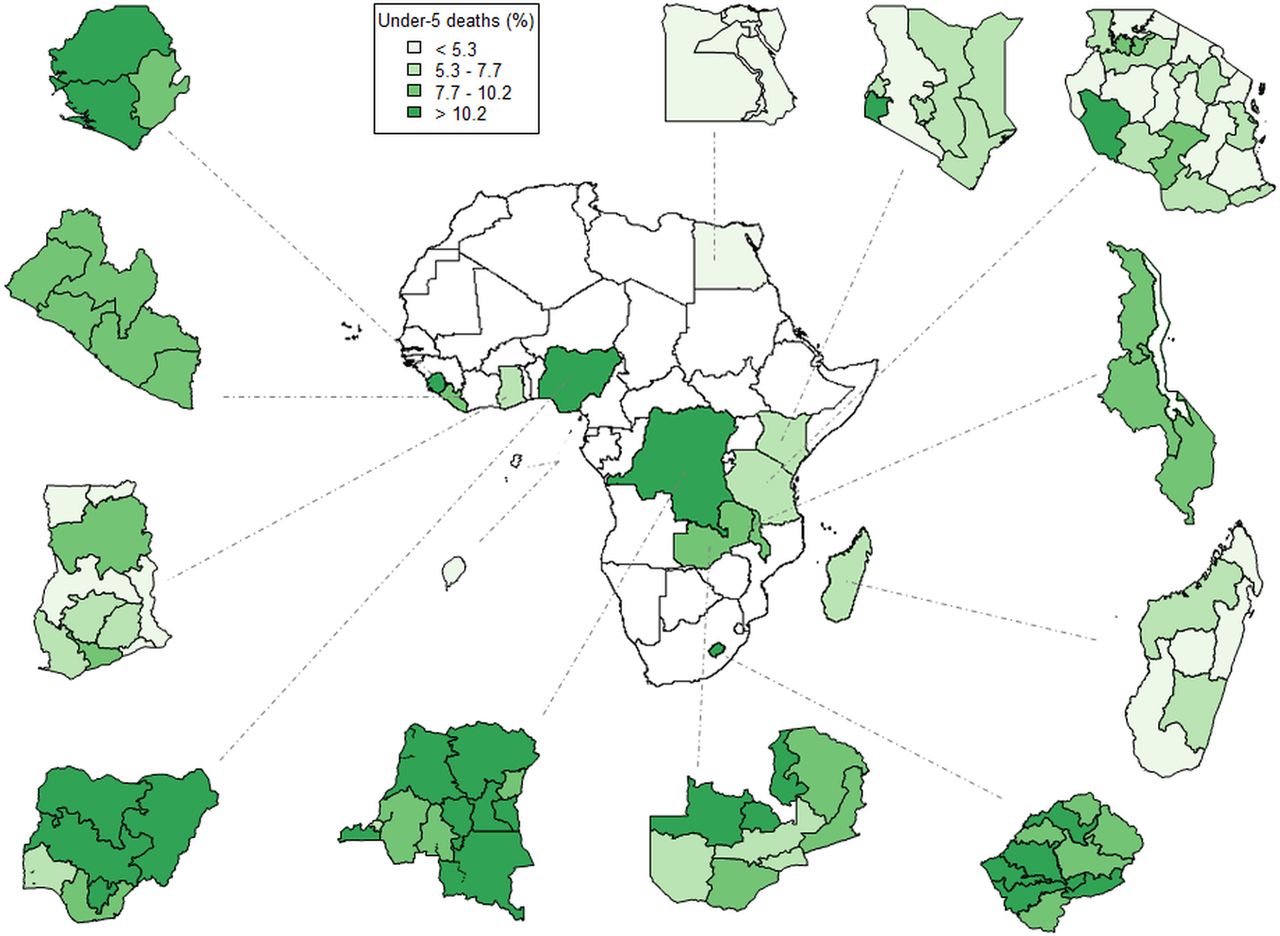
Figure 1 maps the national and regional proportions of under-5 deaths in the 13 countries. This figure highlights the differences that exist between countries and within countries. Some countries have a uniformly distributed low (<6% in all regions in Egypt, Sao Tome & Principe) or high (>8% in all regions in Sierra Leone, Lesotho) under-5 mortality. But in other countries, some regions stand out. For instance, the South West region of Nigeria shows a relatively low figure compared with the rest of the country (table 1, p<0.01), and the Nyanza region in Kenya shows a relatively high figure compared with the rest of the country (table 1, p<0.01).
Proportion of under-5 deaths (%) by determinant in the 13 countries (Demographic and Health Surveys 2007–2010)

Proportion of under-5 deaths (%) in the 13 countries: national and regional levels, Demographic and Health Surveys 2007–2010. Quantiles were calculated across all regions from the 13 countries.
Countries’ average under-5 mortality and wealth-related inequality
Figure 2 compares the 13 countries in terms of wealth-related inequality in under-5 mortality, measured by C*, and average under-5 mortality. With the exception of Tanzania, Malawi and Zambia, all countries showed a negative C*, under-5 mortality being more concentrated among the poorer households. The measure was significant (upper limit of the CI being below 0) in five countries: DRCongo, Egypt, Madagascar, Nigeria and Sao Tome & Principe. Under-5 mortality ranged from 2.48% in Egypt to 11.14% in Nigeria. Across all countries, the median under-5 mortality was 8.25% (Interquartile range: 6.12%–10.29%). Among countries with the lowest under-5 mortality, Sao Tome & Principe had the highest level of inequality compared with Egypt and Madagascar (C*=−0.032 (−0.052 to −0.013), −0.012 (−0.018 to −0.005) and −0.013 (−0.022 to −0.004), respectively). Among countries with the highest under-5 mortality, DRCongo and Nigeria had the highest level of inequality compared with Sierra Leone and Lesotho (C*=−0.050 (−0.065 to −0.035), −0.057 (−0.065 to −0.050), −0.007 (−0.027 to 0.013) and −0.018 (−0.038 to 0.001), respectively).

Wealth-related inequality in under-5 mortality versus average under-5 mortality in the 13 countries, Demographic and Health Surveys 2007–2010. *Erreygers’ corrected concentration index.19
Wealth related-inequality in under-5 mortality: patterns
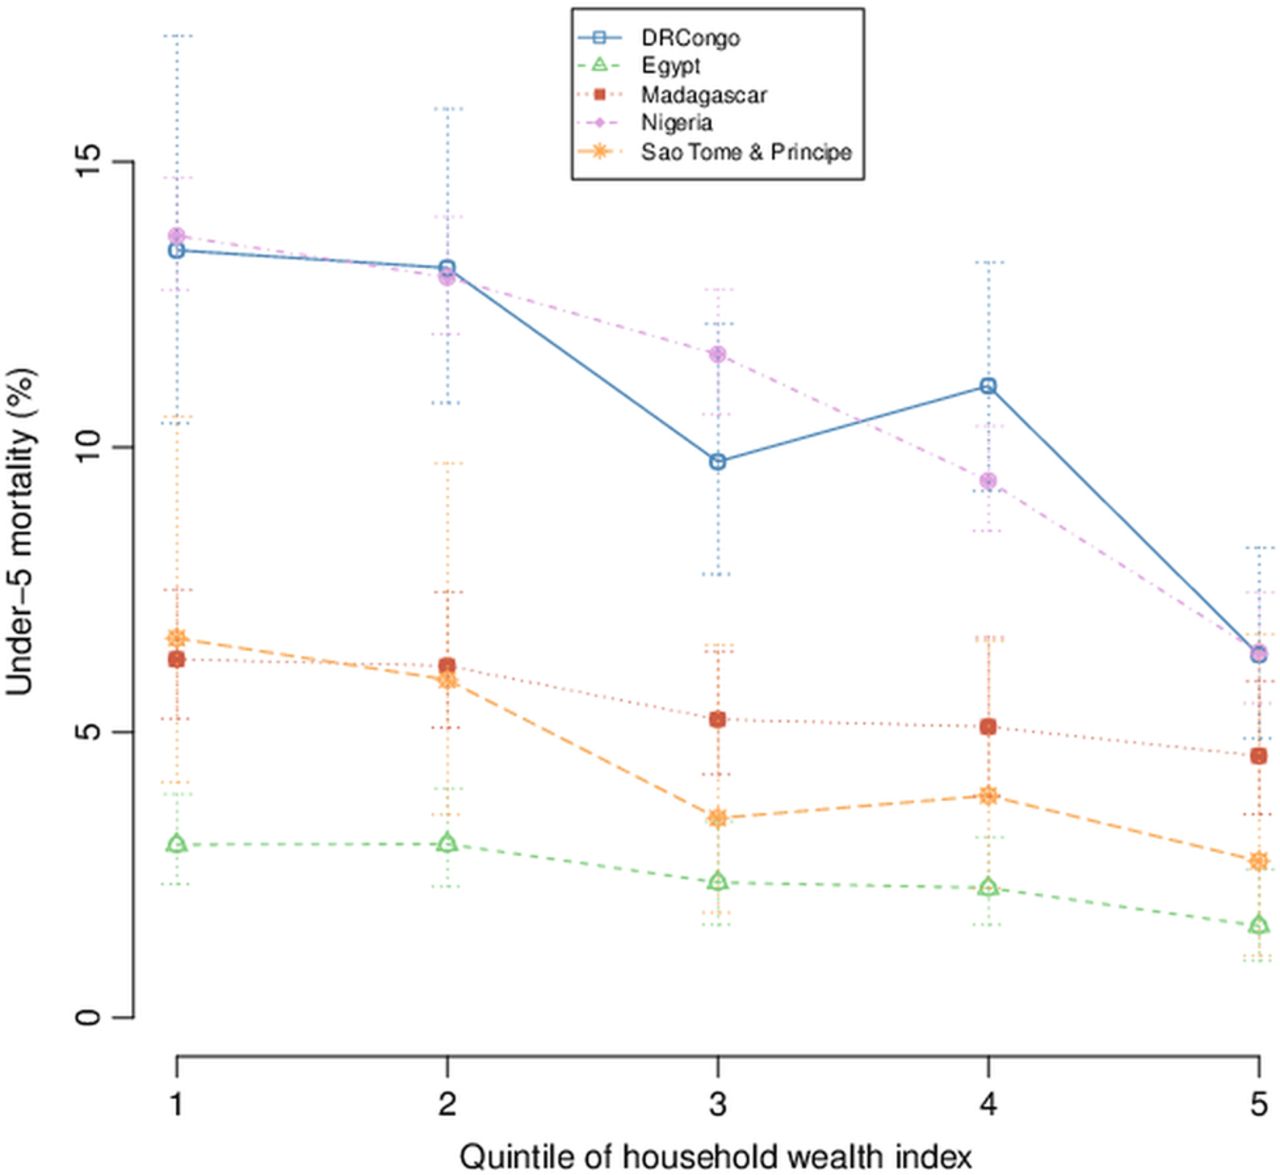
Figure 3 plots average under-5 mortality by wealth quintiles in the five countries where the concentration index was significant. The obtained patterns illustrate the form of wealth inequity: ‘mass deprivation’—the entire population is affected except the richest minority, ‘exclusion’—only the poorest minority is affected or ‘queuing’—middle-income and upper-income groups are better-off than low-income groups.24 For Nigeria, the curve can be compared with the ‘queuing’ pattern of inequality: under-5 mortality exceeds 12% in the majority of the population while children from quintile 4 and particularly quintile 5 have a much better survival. The DRCongo and Sao Tome & Principe patterns show a similar ‘queuing’ pattern except that in these two countries quintile 3 seems less affected than quintile 4. Finally, in Madagascar and Egypt, under-5 mortality follows a more linear gradient across wealth quintiles.

Trends in wealth-related inequality in under-5 mortality in DRCongo, Egypt, Madagascar, Nigeria and Sao Tome & Principe, Demographic and Health Surveys 2007–2010.
Determinants associated with under-5 mortality in the univariate and multivariate analyses
Under-5 mortality by determinants’ categories in each country is presented in table 1, and CIs are presented in an online supplementary appendix. Considering countries with significant differences across categories of determinants, under-5 mortality was higher in children from poorer households; with no skilled birth attendance; being male; with a short (<24 months) preceding birth interval; first or ≥5 in the birth order; living in rural residence; from parents with a low education level; or from parents working in the agricultural sector. In six countries, under-5 mortality also differed by region. Regression coefficients of the multivariate logistic regression are presented in table 2. When controlling for the other variables, in most countries, mortality was higher for male children; with a short preceding birth interval; or first in the birth order. The remaining determinants showed heterogeneous effects across countries.
Multivariate logistic regression of under-5 mortality: regression coefficients and significance in the 13 countries, Demographic and Health Surveys 2007–2010
Determinants’ contributions to overall inequality and to wealth-related inequality in under-5 mortality
The more a determinant is prevalent, associated with the outcome and unequally distributed, the more it contributes to inequality. The contribution of determinants to overall inequality and to wealth-related inequality in under-5 mortality is shown in table 3. The first column shows the Gini index (above) and the concentration index (below) for each country. The following columns show contributions by determinants, adding up to 100%. For instance, in Egypt, birth order and interval contributed to 35% of the overall inequality in under-5 mortality and to 33.4% to wealth-related inequality in under-5 mortality.
Relative contribution (%) of determinants to overall inequality (G) and to wealth-related inequality (C) in under-5 mortality in the 13 countries, Demographic and Health Surveys 2007–2010
First, overall inequality in under-5 mortality, measured by the Gini index, was decomposed into its contributing determinants. Birth order and interval was the most important determinant in a majority of countries. But in Ghana, Kenya and Tanzania, most of the overall inequality in under-5 mortality was explained by regional differences. In Sao Tome & Principe, the determinant contributing most to the overall inequality was mother's education. Among the remaining determinants, the contributions exceeding 10% included: household wealth (Egypt), skilled birth attendance (Lesotho), sex of the child (Lesotho, Liberia, Malawi, Sao Tome & Principe), mother's age at birth (Lesotho, Liberia), type of residence (Nigeria, Sao Tome & Principe), father's education (Ghana, Kenya, Liberia), mother's occupation (Liberia) and father's occupation (Egypt, Ghana). Skilled birth attendance appeared to contribute less to overall inequality in under-5 mortality, except in Lesotho, Madagascar, Sao Tome & Principe and Sierra Leone where it was still substantial (>5%). Results obtained by Shorrock's decomposition of the variance were similar.
Further, the decomposition of wealth-related inequalities in under-5 mortality was applied to countries where C was significant. Here, unlike in figure 1, C had positive values because it measures inequality in predicted (ln odds) under-5 mortality, which has a negative mean. But in Sao Tome & Principe, as some children had a positive predicted value (a very high death probability), G and C measures were corrected (the minimum value was subtracted from all observations) and their sign is therefore inverted. The major determinants of wealth-related inequality in under-5 mortality differed in each country. In Egypt, inequality was mostly explained by household wealth itself, birth order and interval, father's education and father's occupation. In Madagascar, birth order and interval contributed mostly, followed by household wealth and skilled birth attendance. In Nigeria, inequality was mostly explained by the type and region of residence. In DRCongo and Sao Tome & Principe, apart from household wealth, mother's education and father's occupation were important determinants of wealth-related inequality. Determinants with a negative contribution (eg, rural residence, mother's low education and some regions) were more prevalent among poor households but negatively associated with under-5 mortality, thereby decreasing the wealth-related inequality.
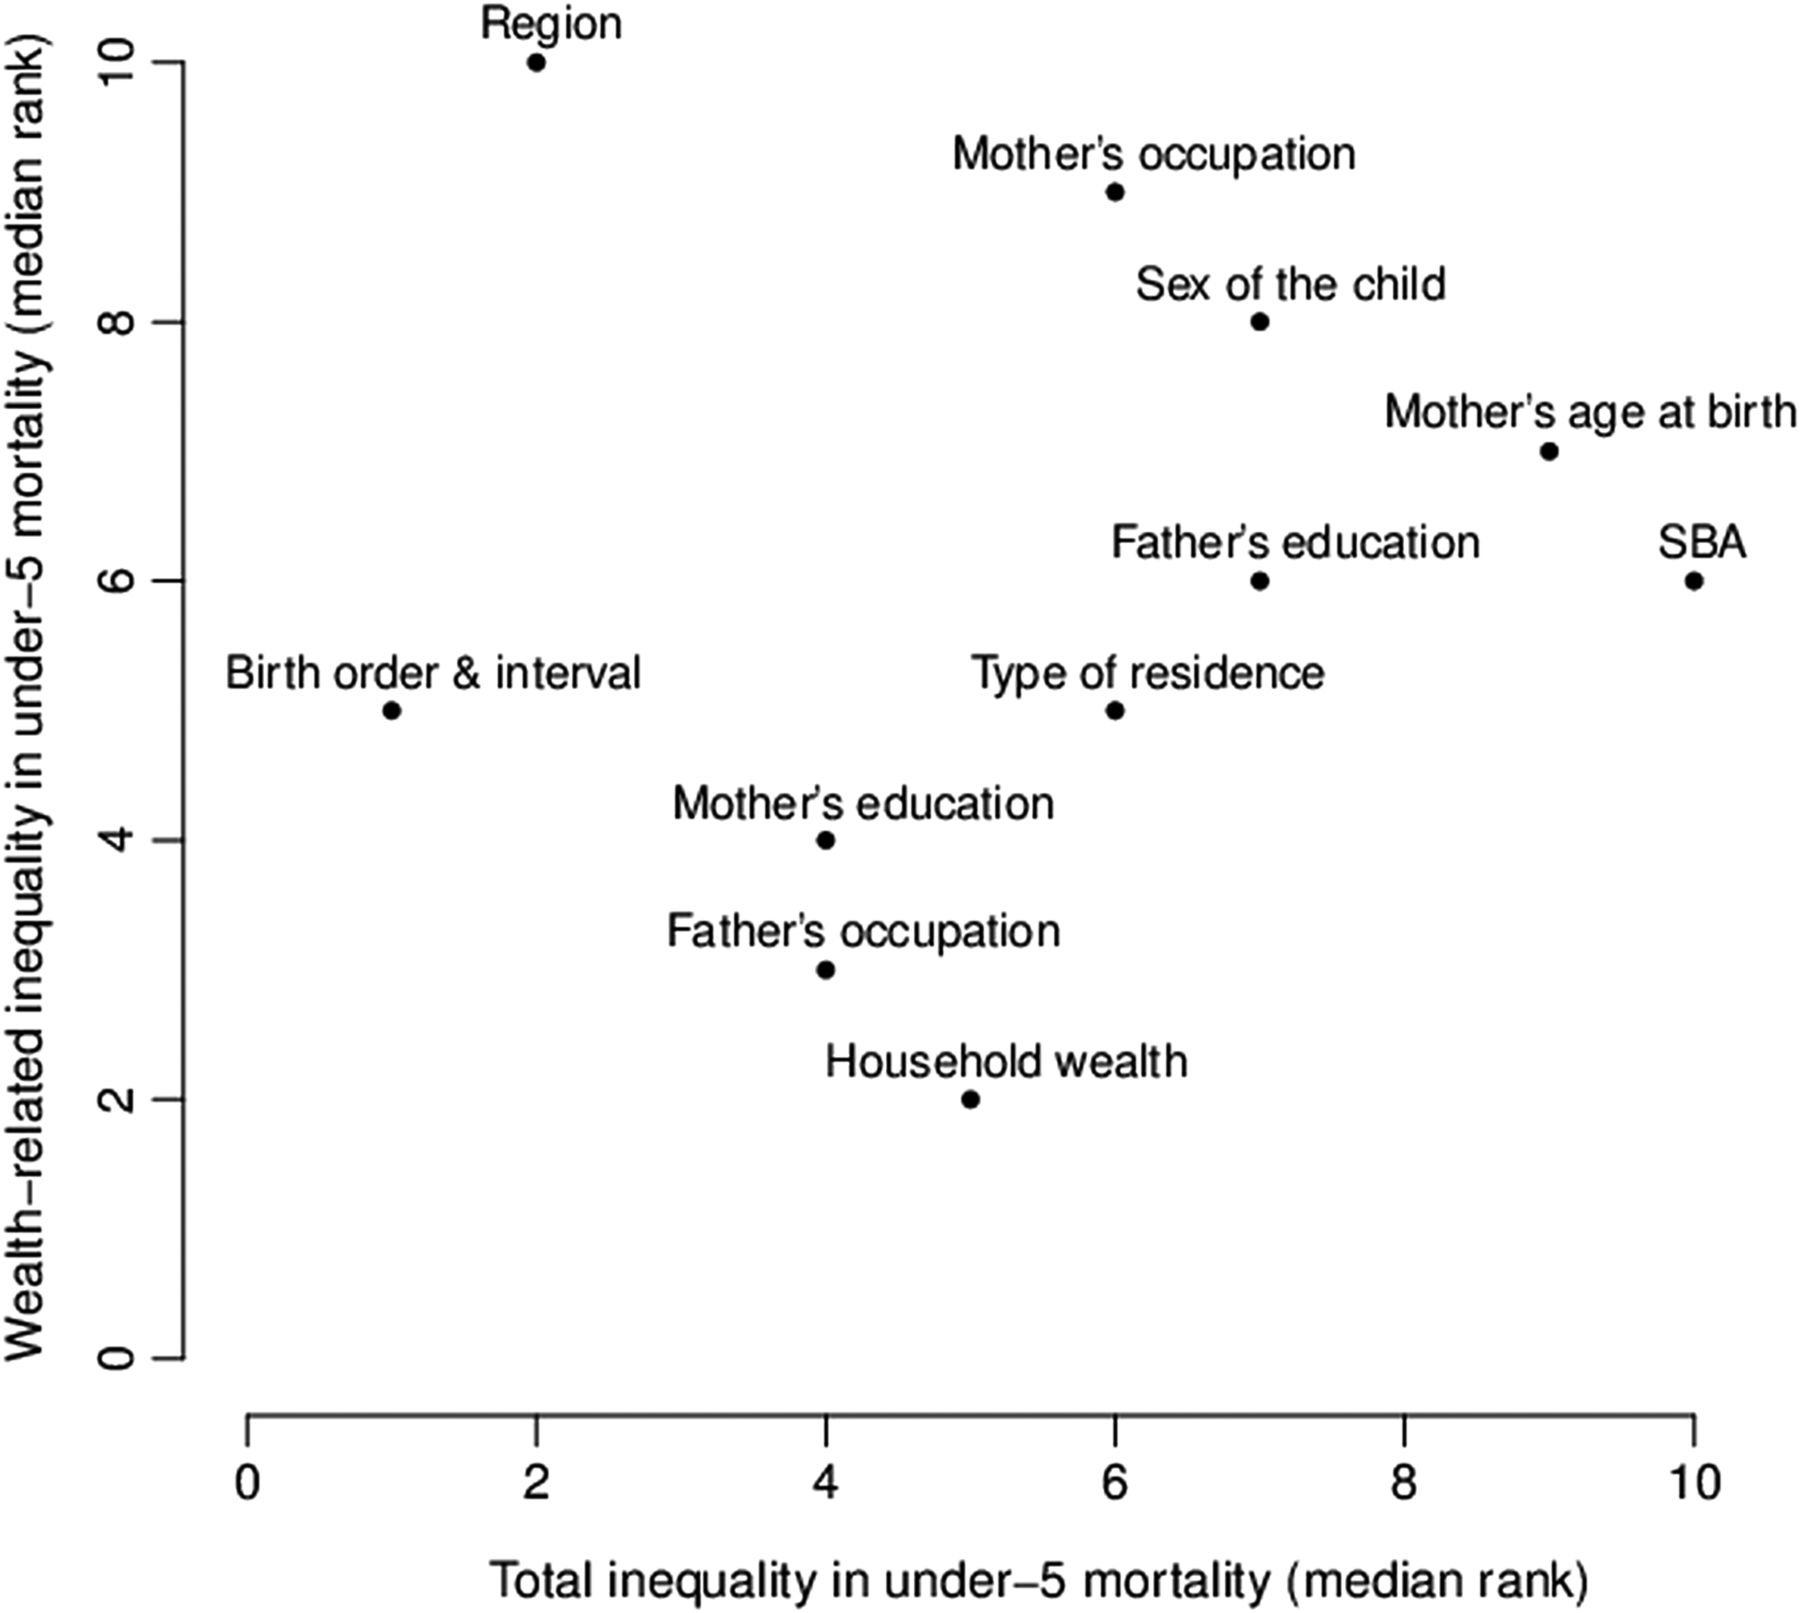
Finally, determinants were ranked according to these contributions and rankings were summarised by determinants in figure 4. Considering the five countries together, determinants contributing most to overall inequality in under-5 mortality were: birth order and interval, region, mother's education and father's occupation. Determinants contributing most to wealth-related inequality in under-5 mortality were: household wealth, father's occupation and mother's education.

Ranking of contributions to wealth-related inequality versus overall inequality in under-5 mortality, five countries, 2007–2010. SBA, skilled birth attendance. Units are determinants’ median rank (1=the first) across the five countries with a significant C: Egypt, Madagascar, Nigeria, DRCongo and Sao Tome & Principe.
Discussion
In the context of increasing awareness about the role of socioeconomic determinants in shaping health and health inequalities, the study investigated the relative contribution of determinants to overall inequality in under-5 mortality and to wealth-related inequality in under-5 mortality in a selection of African countries. In almost all countries, birth order and interval and region contributed the most to the overall inequality. In the five countries where wealth-related inequality was significant, household wealth, father's occupation and mother's education were overall important contributors, though differences were observed between countries.
The measure of C allowed the distinction of countries that require a whole population improvement of child health: Tanzania, Ghana, Kenya, Liberia, Malawi, Zambia, Sierra Leone and Lesotho and those that would also benefit from the addition of more poor-targeted interventions: Egypt, Madagascar, Sao Tome & Principe, DRCongo and Nigeria. C of under-5 mortality was reported for preceding DHS—Ghana 2003, Kenya 2003, Madagascar 1997, Malawi 2000, Nigeria 2003, Tanzania 2004 and Zambia 2001—by the World Bank.25 In this report, Madagascar, Zambia, Kenya, Malawi and Ghana had a significant negative C. Though wealth-related inequality in under-5 mortality may have decrease since the last DHS, the difference in significance with results reported here can result from sample size: under-5 mortality was assessed until 10 years before the survey, whereas in the study at hand it was restricted to a 5-year period. A study using 1990–1999 DHS data from 60 countries showed a negative association between the level and inequality in under-5 mortality; countries with the highest level of under-5 mortality had a lower inequality.26 In the study at hand, no significant relation between C* and average under-5 mortality was observed, possibly explained by only using a limited set of African countries with most of these not showing under-5 mortality inequalities.
The regression analysis identified already known determinants of under-5 mortality in sub-Saharan Africa: household wealth, region, type of residence (rural/urban), parent's education, birth order and preceding birth interval and skilled birth attendance.8–15 In addition, the analysis revealed an independent effect of the sex of the child; mortality was higher in males in Lesotho, Malawi, Nigeria and Sao Tome & Principe. This effect, already observed at the univariate level in the respective DHS reports,7 was also shown in a study assessing individual and community level effects on child mortality in 28 sub-Saharan African countries.27 An excess male infant mortality was previously observed in high-income countries.28 This male disadvantage was most likely explained by biological factors such as a lower resistance to infection, a higher risk of premature birth and a larger average body size and head circumference leading to difficult labour. A community-based cohort study performed in rural Malawi documented a twofold mortality risk among 1-year-old to 2-year-old boys compared with girls of the same age.29 In this subpopulation, possible explanations tended more towards biological (eg, malnutrition or sex-specific differences in vaccine effects) than behavioural (eg, preferential care) assumptions.
The analysis of the contribution of determinants to overall inequality in under-5 mortality allowed the determinants to be classified by importance. The relative importance methodology is increasingly used as a supplement to multiple regression analyses to better understand the role played by each predictor in a regression equation.30 The analysis was performed by decomposing the Gini index. The same analysis was also performed by decomposing the variance using Shorrock's method,23 which gave similar results. Results could guide interventions aiming at reducing overall inequality in under-5 mortality by prioritising its determinants at the national level. For example, high parity and short-birth interval could be targeted through family planning in countries where birth order and interval explains most of the overall inequality in under-5 mortality. Increasing health promotion coverage and access to healthcare, for example, through decentralisation of health services, could be envisaged as a priority in countries where regional differences are the most important.
This is, to our knowledge, the first study investigating socioeconomic determinants of wealth-related inequality in under-5 mortality in Africa. In countries where wealth-related inequality was large, identifying determinants contributing the most to this inequality may help in prioritising interventions aiming at reducing socioeconomic inequality in under-5 mortality. Reducing wealth inequalities, for example, through community loans, would be relevant in countries where household wealth has a major and direct effect on inequality. But in countries like Sao Tome & Principe or DRCongo, where mother's education explained most of the wealth-related inequality, the priority could be education and health promotion. The substantial contribution of the type and region of residence in Nigeria, independent of the other factors, may reflect inequality in healthcare access and could be more investigated. The role of father's occupation in wealth-related inequality could also be more investigated in countries where this determinant was important.
The study has a number of limitations. The transversal design of the survey does not allow the order of events to be taken into account (eg, the household was not necessarily in the same wealth quintile or region at the time of the event). Information of child death was collected retrospectively by interviewing mothers and therefore relies on the mother's will and ability to communicate the information. Other determinants reported elsewhere, for example, birth weight, breastfeeding, antenatal care, ethnicity or religion10 ,31 ,32 were not included in models for analytical reasons (multicollinearity or high number of missing values). Age of children at the time of the survey was not taken into account; however, regression coefficients remained unchanged when adding theoretical age in the models. Finally, the interpretation of global patterns merging countries as diverse as Egypt and Nigeria in terms of national income and under-5 mortality must be done being mindful that the socioeconomic and political context plays a proximate role in the process to inequalities as illustrated in the conceptual framework proposed by CSDH.6
Conclusion
Generally, the main determinants of overall inequality in under-5 mortality were birth order and interval and region. The main determinants of wealth-related inequality in under-5 mortality were household wealth, father's occupation and mother's education. At the national level, the identified determinants contributing the most to either overall inequality or wealth-related inequality in under-5 mortality could serve as targets to improve both average child survival and equity.
What is already known on this subject?
▸ Despite substantial progress in reducing average under-5 mortality, disparity in under-5 mortality remains high. ▸ Understanding the underlying determinants is essential to develop appropriate policy responses.
What this study adds?
▸ The relative contribution of several determinants to overall inequality in under-5 mortality is given for 13 African countries. ▸ For five African countries with a significant wealth-related inequality in under-5 mortality, the relative contribution of the same determinants to this wealth-related inequality is given as well. ▸ Interventions aiming at reducing either overall under-5 mortality or socioeconomic inequality in under-5 mortality can therefore be prioritised.
Acknowledgments
We thank the Measure Demographic and Health Survey programme for the datasets. We are grateful to Irene Ogali for her contribution to the application of Shorrock's method and to Corey Sparks for his assistance with the creation of maps. We would like to express our thanks to the reviewers for their constructive and interesting comments.
References
Supplementary materials
Supplementary Data
This web only file has been produced by the BMJ Publishing Group from an electronic file supplied by the author(s) and has not been edited for content.
Files in this Data Supplement:
- Data supplement 1 - Online appendix
Footnotes
-
Contributors NS designed the study. CVM analysed the data and wrote the manuscript. NS and HVO supervised the study and reviewed the manuscript.
-
Collaborators Irene Ogali contributed to the application of Shorrock's method and Corey Sparks assisted with the creation of maps.
-
Funding This study is part of a PhD thesis financially supported by the Université Catholique De Louvain, Brussels, Belgium.
-
Competing interests None.
-
Provenance and peer review Not commissioned; externally peer reviewed.